Networks, visualizations, and the space-time conundrum
Back in November Hestia2 held its second seminar in a place where the sun really does always shine (see below): Stanford, California. There was a very good reason, in addition to being able to wear a t-shirt in November, for holding a seminar on Digital Humanities in Stanford. With its campus in Palo Alto, Stanford shares a location with a number of high-tech household names, including Apple, Google and Facebook, while smaller start-ups in the San Francisco Bay Area are but a short Caltrain ride away. One of these, Farallon Geographics, has recently worked with the Getty Conservation Institute and World Monuments Fund, to produce an open-source, web-based, geospatial information system for cultural heritage inventory and management, called Arches, showing the massive potential for collaboration between private digital enterprise and the public cultural sector, including higher education.
While Arches was one of the independent digital projects that we heard about at the Hestia2 seminar, most came from the university itself, primarily through its Stanford Literary Lab. Research teams in this venture stand at the forefront of digital development and its intersection with the Humanities. And time and again, the issues that were raised had both to do with the exciting possibilities afforded by digital technology but also the work still needed to make these technologies speak to the concerns of humanistic criticism. Primary among these concerns are networks, visualization, and the space-time conundrum.
For example, Franco Moretti, Zephyr Frank and Ryan Heuser discussed the use of Network Theory for thinking about dramatic structure within Classical tragedy. A simple comparison of character interaction networks brought to light the remarkable symmetry of Racine’s plays in contrast to the significant asymmetry of Shakespeare’s dramas, a comparison which included the high percentage of one-on-one interaction in Racine as opposed to Shakespeare’s fondness for triangulated relations (or even more complex engagements). But their latest work marks a shift away from viewing the networks as complete to the use of networks as windows on to character interaction, since networks are not experienced all at once by the characters in the play, but shift and develop over time. Throughout, the emphasis was placed on experimentation: using digital methods—in this case network visualizations—to create models and test hypotheses. (For detailed discussion, see the pamphlets published on their website.) Along similar lines we heard from Dan McFarland from the Business School, who is using a dataset of notes passed by children to each other in class, with the aim of reintroducing “warmth” (emotions) back into analysing relationships. Rather than focusing purely on who talks to whom, Dan’s work looks at how the children talk about their relationships— whom they speak about, what they speak about and, above all, how—in order to understand better how these networks reflect their social world.
Also dealing with networks are Classicist Walter Scheidel and computer genius Elijah Meeks. Their Orbis system—a Geospatial Network Model of the Roman World—reconstructs the time cost and financial expense associated with a wide range of different types of travel (by road, river or sea) in antiquity. As they pointed out, however, their initial model used pre-generated cartograms based on important places (Rome, Constantinople) and particular settings (least cost, etc.), for a greatly simplified version of the giant network of movement across the Roman Empire. What it didn’t do was to allow the user to ask their own questions and, say, build their own cartogram around any node within the network based on any settings. With this in mind, they gave us a sneak preview of Orbis 2.0, which, like a “choose your own adventure novel”, will mean that a user can do things from any point and refashion the network around it. Yet, in spite of this critical aspect of exposing the model so that a user can understand how results are produced, Walter admitted that only Elijah—the technical wiz—really knows how it all works! The challenge to make such a powerful set of tools available to and understandable for the humanist user remains an ongoing issue.
It is exactly this issue of putting the tools in the hands of the user that Nicole Coleman and Giorgio Caviglia are seeking to address with their project Palladio. Nicole was director of the Republic of Letters, a project that sought to visualize the scholarly networks from the age of Erasmus to the age of Franklin through an aggregation of the correspondence written by scholarly superstars like Voltaire, Galileo and Locke. But, while the network visualizations are indeed striking, the conclusions that they might point to are shakier, since—as Nicole pointed out—only about 10% of the data was shown at any one time. (Each letter needed a source location, destination and date in order to show up.) As a result, Nicole’s group has teamed up with an Italian Graphic Design company, called Density Design, in order to put the researcher at the centre of the interface with the data. Palladio will be a tool to allow scholars and students to work with the data: to choose your own parameters and search by time, or by the people mentioned in the letters, or by the places, or by the language, etc. This is why their visualization will initially confront the user with a blank canvas. It will make you think about the process of working with the data, specifically what data you’ll be mapping and, crucially once more, why.
Last, but by no means least, came the presentation on Topotime by Geographer Karl Grossner and that man Elijah again. With the projects mentioned above, the idea of space has been critical. Indeed, one of the reasons why digital visualization is becoming so popular in humanistic criticism is precisely because of the ability to bring to the surface the spatiality of texts—what places are mentioned, how often, in relation to what other locations, etc.—questions, indeed, that the Hestia project is working on in relation to Herodotus’s Histories. As important as space or place, however, is time: but temporality is much harder to capture and map. With places, you have a place name: this may change over time, but with projects like Pleiades—the gazetteer of the ancient world—and the gazetteer ecosystem that Pelagios is building, it is possible to disambiguate places, differentiate places from each other, and more importantly link resources that refer to the same place, so that a place’s life history can now be told. But one only has to think about the different dating systems used—800 BC, archaic Greece, antiquity—depending on your interests, without even getting on to the problem of scale, range and uncertainty, to appreciate the complexities involved in mapping time. Topotime represents the first steps towards this, of being able to represent an assertion, whether that assertion comes after, before, during, part of, etc. another. Once again, the intent is not to resolve the issue but rather to expose it—to allow scholars to manipulate the visualization and experiment: “The event could have happened here but let’s see what happens if we drop it there.”
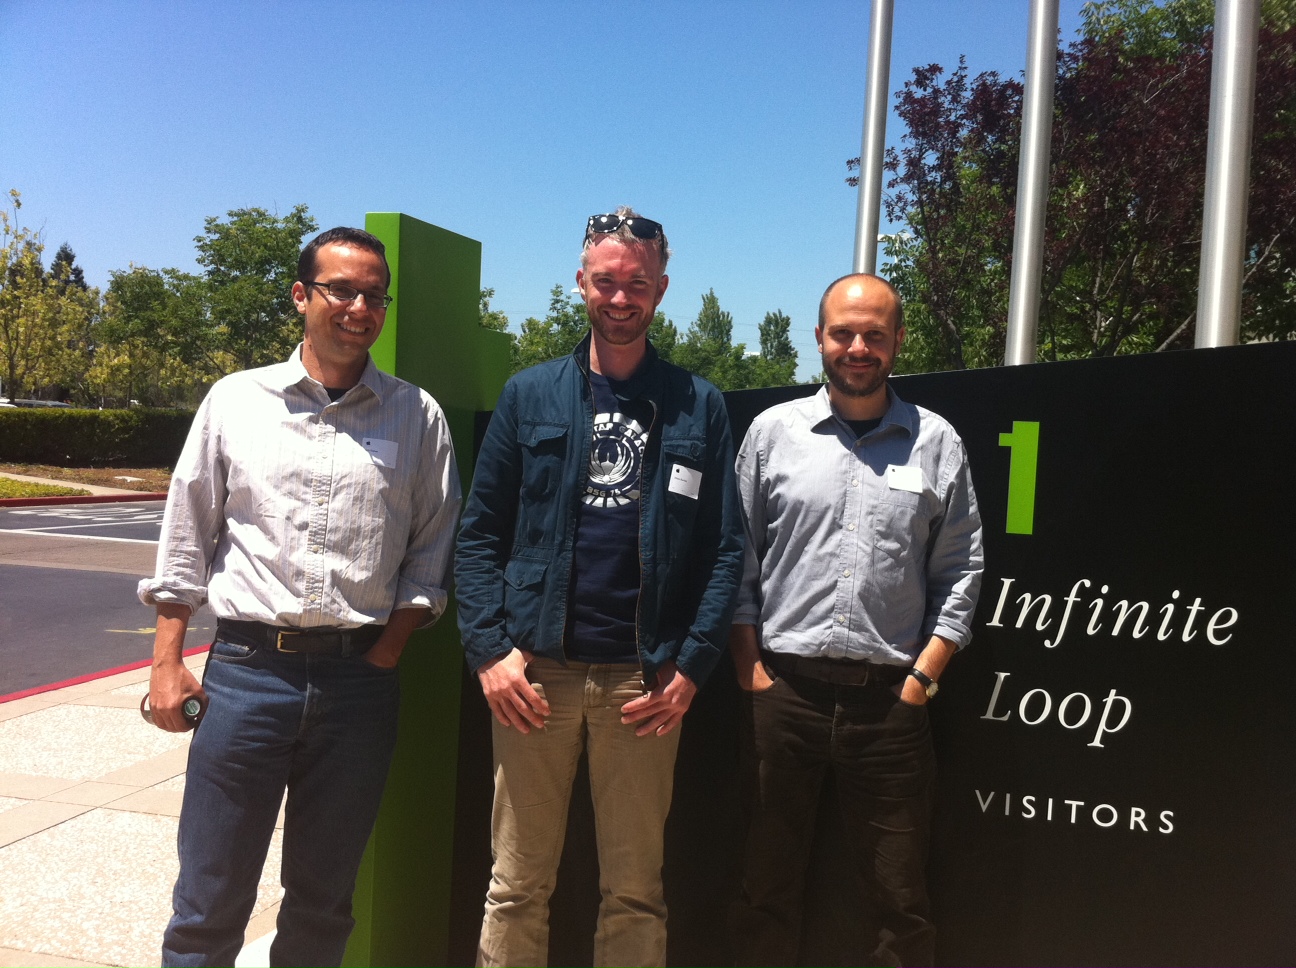
Elijah and Karl will share their experiences of these issues, in relation to Orbis and Topotime, in subsequent posts. As for our own experiences of the space-time conundrum, here’s a picture of me, Leif and Eric contemplating whether it’s lunchtime yet at the home of Apple: 1 Infinite Loop, Cupertino CA.