Reading Herodotus spatially in the undergraduate classroom, Part III
This is the third and last of three posts reporting on the deployment of the Hestia toolkit to teach Herodotus’ Histories in two college classrooms at The University of Texas at Austin. The previous post described the design of an upper-division research seminar, intended for Ancient History, Classics, and Classical Archaeology majors, that integrated Hestia resources with training in historiography and network visualization. This post explores how that course design worked in practice, discussing successes and failures from the perspectives of both students and instructor. It’s a long post, but the conclusions are summarized at the end, so the impatient reader can jump to the bottom.
Most teachers are aware of the gap between the ideal version of a class created during the design process and the way that class unfolds in practice over a semester. For most of us, the practical version includes dead ends, failed experiments, course corrections, and — if we’re lucky — some unexpected successes. In some cases, elements that we initially saw as core components of the class turn out to be less important than aspects that we treated as peripheral when we designed it. In other cases, canonical core material crowds out digressions we hoped to spend time exploring. In this class — officially titled “Watching the Barbarians: Herodotus, Ethnography, and Archaeology” — both of these things happened. This isn’t at all unusual. But what makes this a particular interesting case study is the way digital technologies interacted with the arc of the course.
I was also fortunate to have a very engaged group of students who were unusually conscious of their own learning and generous with insightful feedback, and so I have an uncommon opportunity to evaluate the class not only on the basis of my own impressions, but also through their detailed comments. The students were a small sample — only three participated in the course-review process — so their feedback is qualitative rather than quantitative, and I can’t claim that it represents student views in general. I hope it will be clear, however, from my summaries of their comments that their observations are broadly relevant.
An instructor’s perspective
I will begin with my own assessment of the course, leaving the student responses for the end of the post. As I said in the previous post, I had four pedagogical goals going into the semester: I wanted to provide the students with an understanding of historiography and the discipline of historical inquiry; I wanted to introduce them to digital tools for social network analysis and visualization; I wanted to help them compare the written testimony of Herodotus with the archaeological record of non-Greek cultures around the Mediterranean; and I wanted to see how the use of the Hestia interface for Herodotus could facilitate some or all of the other goals.
I’ll leave the effects of the Hestia interface for later. I’d like to concentrate first on the first three goals, which are more clearly defined from a pedagogical perspective. Of these, by far the most fully realized was that of training in historiography. This was the most traditional and conservative of the three, and the one most in keeping with the purpose of these research seminars. Our approach to it was also the most methodologically standard: we read articles about Herodotus and his role in ancient historiography, and then we discussed them. These analyses of Herodotus and the Histories could then be used as platforms for the students’ research projects. It was my impression that we were able, as a class, to develop a solid understanding not only of Herodotus’ own methods, but also of the different ways that modern scholars have reacted to his work over time. At least one of the final papers responded very specifically to some of this secondary scholarship.
I suspect that both the students and I were most comfortable within this framework, which is probably why it was the easiest goal to reach. It was also the goal that required the least involvement of digital tools, although, as I will show later, several of the students found the Hestia interface useful for understanding the structure of the Histories. The second most successful element, however, was also the most digitally-oriented: we made a significant amount of progress in understanding and applying basic social-network-analysis tools and principles to the Histories.
This progress came with far more frustrations and reversals than the study of historiography, however. We began with what I thought would be a simple assignment: we each took an individual or group actor in the Histories and kept a spreadsheet documenting the interactions of that actor with other individual or collective actors in the work. I took on all individual interactions in book 1; the students were supposed to follow group actors (Samians, Achaemenid rulers, and Athenians) across the first four-and-a-half books. These spreadsheets documented interactions — edges, in network-analysis parlance — while we kept separate spreadsheets describing the parties to the interactions (the nodes), including their home cities. At the end of the semester, I merged all of our data from book 1 into one edge table and one node table (please feel free to copy these if you’d like to see how they work in network visualization platforms; they’re formatted for Palladio and might require some tweaking to work with Gephi or other programs).
Although this idea was relatively straightforward, we quickly fell down the rabbit-hole of classification. It was not always even clear what interactions could be recorded: if, for example, Herodotus provides two alternate stories about the same historical episode, should both be put down in the edge table? One? Neither? And as our classification scheme became more complex, it became even harder to figure out how to classify ambiguous, conflicting, or unlikely reports. When Lichas the Spartan persuaded the Tegean blacksmith to rent him the courtyard where he’d found the bones of giant Orestes, for example, was this an economic transaction or an act of war? Or an apocryphal story that shouldn’t be included at all?
Digital technology made it substantially easier for us to work these issues out, simply by providing a collaborative space in which we could do so. The class maintained a shared spreadsheet in Google Drive which we proposed and discussed different classifications, both through asynchronous dialogue in notes in the spreadsheet and in real time using the Drive document-chat function. We did this in the classroom as well, but this made it possible for us to work even when we were physically separated — during the several ice-days that closed the UT campus that spring, for example — and also allowed us to pull in specialist help. During one of our collective classification-editing sessions, for example, Tom Brughmans generously joined the discussion from the UK, and helped us to realize that more complexity is not always better. He pointed us to a paper in a physics journal on networks in ancient epics that, while controversial within the network-analysis community, showed how simple binary categories could be used for more compex analysis (Carron and Kenna, the authors, used only two classifications — friendly and hostile — to describe their edges). We borrowed this binary schema for the top-most level of our classification, differentiating interactions in which the interests of the participants were aligned from those in which they were opposed (although it is worth noting that we never used any of our classifications for actual statistical analysis, which went beyond the scope of the course).
Once we had set up our spreadsheets, we used these as trial datasets to explore different visualization platforms. I had originally planned to introduce three different platforms: Cytoscape, for which Tom Brughmans had created an excellent tutorial; NodeXL, which is Diane Cline’s preferred visualization platform, and which I’d already seen her apply to ancient historical sources; and Gephi. Although we did a certain amount of experimentation with all of these, it quickly became clear that it would be difficult for all of us to become proficient in all of them, and as we realized that our work was not going to go beyond the level of basic visualization, most of our attention began to be directed toward Gephi alone.
This was probably due in part to Gephi’s user interface, which all of us found somewhat more intuitive than Cytoscape or NodeXL. But it was also the result of two functionalities that we quickly realized were critical for the sorts of visualizations we wanted to produce: extensions to Gephi permit one to visualize a network in space (using the GeoLayout and Maps of Countries plugins) and across time (using Gephi’s built-in timeline function, facilitated by Clement Levallois’ Eonydis extension). Our emphasis on these axes may have been in part the result of our use of the Hestia text, which visualizes the narrative in this manner, but it is also true that both time and space are inherently important to the investigation of ancient Mediterranean history.
It was relatively straightforward to represent our networks in space — although we had to remember to run the Maps of Countries plugin first, and then the GeoLayout plugin, if we wanted the map to match our node coordinates. Representing them in time was trickier. Absolute time was out of the question: not only are solid dates in the Histories rather sparse, but Eonydis was not able to handle BC dates (or those with years with fewer than four digits). We decided, therefore, to take the same path as Hestia and use the narrative time — the flow of book and chapter — of the Histories as our temporal axis. Here, however, we could not simply record book and chapter numeration, because Eonydis only works with dates in recognizable formats. We therefore followed a suggestion for a kluge by Shawn Graham, who solved a similar problem by creating artificial relative dates in the format required by the software. This led us to add to our spreadsheets a column called “pseudo-date”, which contained a translation of the book-chapter structure of the work into a sequential date format. In this column, the first interaction to appear in book 1, chapter 65 was coded as “1065-01-01”; the second interaction in the same chapter as “1065-02-01”; and the first interaction in the next chapter as “1066-01-01”. This format worked with Eonydis and the Gephi timeline, as is shown in this screencast of a time-enabled Gephi network of relationships between Athens and other actors across the Histories (the “time” is narrative time expressed as a series of relative “pseudo-dates”).
A screencast of an animation of a geolocated dynamic network created in Gephi by student Alenis Leon. The network represents the cumulative interactions between Athens and other actors as they develop across the first five books of the Histories.
Toward the end of our struggle to visualize networks in time and space using Gephi, a dark-horse online digital tool emerged to win over the students altogether. In the middle of the semester, the Humanities + Design lab housed in Stanford’s Center for Spatial and Textual Analysis released the first version of its Palladio visualization platform. This web-based interface allows the user to upload a spreadsheet or CSV file containing an edge or node table, extend the spreadsheet by connecting it to another table (for instance, an edge table to a node table that associates each node with geographic coordinates), and then represent the contents as a map, a map with edges between connected nodes, or a non-cartographic graph. It also includes a timeline facet that can display dates in a specific format — again, YYYY-MM-DD, currently only AD dates, though an impending release will deal with BC dates as well — to allow dynamic network displays (but only in Chrome — it never worked properly in Firefox).
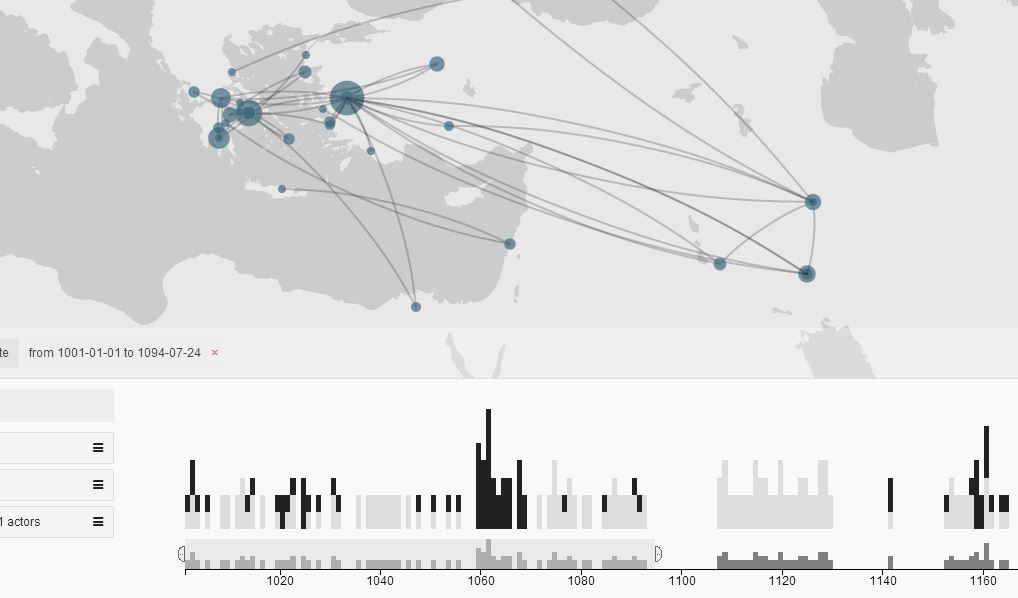
A screencast of an animation of a geolocated dynamic network created in Palladio, using the slider in the time facet. This represents all the interactions between individual actors, and between the collective actors tracked by the students, in book 1 of the Histories. Here the interactions are non-cumulative. At the end of the screencast, the two categories into which the timeline is divided are highlighted: first non-Greek (“0”), then Greek (“1”).
The students found this interface much simpler to use than Gephi, and for the latter part of the semester focused their attention on it — thus finalizing the course transition from network visualization with the potential for analysis to visualization alone (Gephi’s statistical tools were less powerful than those available in Cytoscape or NodeXL, and Palladio doesn’t offer any statistics at all). They only had two major criticisms of the platform: it was not at that point possible to save or share your work (a subsequent release has made it possible to save a JSON output that can be uploaded back into the platform — you can download our Palladio visualization of book 1 as a .txt file here: Data export.palladio.0.9; just change the extension to .json); and the timeline didn’t have a play button, as Gephi does, to automatically play through the evolution of a network.
This last point may seem trivial, but I think the students were very right to highlight it. Palladio explicitly bills itself as an exploratory tool, not an analytical one — that is, a tool that is meant to allow the user to find patterns in the data that he or she can then examine in more detail, either qualitatively or quantitatively, rather than a tool that allows the user to draw scientific conclusions about the dataset. The development of our class showed that my students, at least, found the exploratory aspect of data visualization most attractive. And watching an animation of your network at a set pace, without having to actively drag a slider, is, I strongly suspect, more conducive to the sort of pattern-recognition that the platform is trying to foster. It is worth stressing again at this point that the recognition of patterns in space and time was clearly established, at least in our experience, as one of the central strengths of digital approaches to ancient history.
Disappointingly for me, as an archaeologist, the archaeological component of the course was the least successful. I had assigned each student a culture to annotate in the Hestia text and to present on in class. I gave a report on the Scythians; the students reported on the Lydians, Libyans, and Thracians (each student chose a group that was relevant for his or her research interests). The reports were perfectly reasonable, although the students all discovered that it was hard to separate Herodotus from the archaeological record for those cultures, since Herodotus had been used so reflexively for so long to explain that archaeological record. This realization was one of the successes of the class, in my opinion. The annotation, however, which I had hoped would lead to the enrichment of the text with references to online archaeological material and additional resources, was a flop.
I think there were two reasons for this. The first was that I failed to integrate it into the class on a practical level: although all the students created accounts and made at least some annotations, I didn’t check them regularly, and we didn’t discuss them. Furthermore, I didn’t make a clear distinction between annotations meant to keep track of actors for the network analyses and annotations related to the archaeological presentations — and since the archaeological presentations came late in the semester, they were pushed to the back burner. As a result, none of us, including me, ended up making any annotations about archaeology in the relevant ethnographic sections of the Histories. Most of the annotations we did produce were related to the networks we were creating (see, for example, my own annotation stream), and while this was productive in its own way, I originally had in mind something of more general use for future readers (for instance, annotations about related ancient places or texts).
The second reason that I think this component of the class was less successful was simply the limited time and energy both the students and I had to contribute. I had already asked the students to deal with a number of unfamiliar platforms and methods, on top of their historiographical training. The Hypothes.is annotation platform wasn’t difficult to use, but it interacted poorly with the dynamic, javascript-based Hestia interface, with the result that every new section had to be reloaded as a separate HTML page in order to add annotations. And I found it difficult myself to read the text, parse interactions to include them in my spreadsheet, and then add annotations while refreshing each page. By the time we got to the archaeological material, no one had the bandwidth left to keep up the annotation. If I have a chance to repeat this class or another one like it, I’ll try to define this component more narrowly and reduce other parts of the course to make room for it.
In the end, I think we successfully met the most central goals of the course: the students’ engagement with the historiographical scholarship led them to think carefully about Herodotus’ sources and the construction of his narrative; the inclusion of a network component caused them to read more carefully and tease out the individual strands of that narrative; and the Hestia narrative timemap helped them to understand the Histories in terms of space, sequence, and causality. Furthermore, I suspect that the geotemporal structure of the Hestia text pushed them to seek out and master visualization tools that allowed them to represent their own networks as both spatial and dynamic entities.
But the additional tools and issues I introduced led to more confusion than enlightenment, and this is the central lesson I’ll take away from the course: I tried to do too many things at once. Historiography and basic network visualization turned out to work reasonably well together; historiography and archaeology, archaeology and network visualization, historiography and annotation, or archaeology and annotation would probably have been equally successful. But throwing all four in together was too much. Instructors with a digital bent can get so excited themselves about the new technological opportunities that seem to emerge almost every week that they forget about the limited energy and time available to the students upon whom they impose them. I routinely use new digital platforms in my teaching, I think largely successfully, but this class was a reminder of the importance — at least in courses that aren’t about the digital tools themselves — of introducing digital components gradually, systematically, and in such a manner that their relation to the course content is clear and well-defined. Many students prefer their digital content in smaller doses than we assume — a lesson that not only instructors but administrators should take to heart.
The student perspective
These conclusions are confirmed by the detailed comments provided by the students who co-authored the Texas Digital Humanities Consortium conference poster I mentioned in the previous post. I will summarize them below, grouped according to the digital components of the class (the Hestia platform, annotation, and network visualization). I will also comment on my own impression of the way that these tools and approaches contributed to their final research papers.
The students’ reactions to the Hestia interface were mixed. On the one hand, they generally agreed that the interface was fairly intuitive, and they found it useful for understanding Herodotus’ geography and the geographic elements that structure the Histories. They were more divided about its contribution to their understanding of the narrative structure of the work or of Herodotus’ ethnographic discussions, though in each case one or two of them found it helpful. On the other hand, all three of them stated emphatically that the interface was not their preferred method for reading the work. I had also assigned the Landmark Herodotus, which they all used as their primary point of entry. The reasons they gave were various — the Landmark version, as a paper book, was easier to mark up and annotate; it could be read more or less continuously, without having to click from section to section; it could be carried around more easily than a laptop; it provided more contextual information, especially dates. Whatever the individual reasons, however, it was quite clear that for all these students an interactive website was no substitute for a physical book. At the same time, they all found it useful as a supplement to the printed text, and usually consulted it after they’d identified passages of interest in the Landmark version.
Some of their suggestions might be useful for future development of the interface, especially in terms of its connection with annotation platforms. One student noted that something as simple as a link to the spoken pronunciation of the proper names in the Histories could help students remember people and places (this wouldn’t be hard — the resources are already available). Links to a spoken version of the text might also improve accessibility. Others felt that the option to read the text as a continuous scroll, as offered by the Perseus project, would be welcome, or that absolute dates should be integrated, or that links to other resources — archaeological objects, contextual information — should be displayed on the place detail pages. At least one of these suggestions has already been implemented: those detail pages now include links to Flickr images that have been machine-tagged with Pleiades URIs. But in each of these cases, the student comments suggest, it would be necessary to get the additional information as close to the main user interface as possible, since they only occasionally clicked through to a place detail page, rarely clicked through from there to the relevant Pleiades page (though several said they regularly looked up sites directly in Pleiades), and never clicked on the Pelagios link.
The students had a similarly mixed reaction to the annotation portion of the course — and, interestingly, similarly divergent feelings about the media involved. All three felt that annotation in general helped them to read closely and resulted in a closer understanding of the work. But they seem to have had in mind physical annotation of a physical text, and they were much more ambivalent about the digital translation of those annotations. As one might expect, they were put off by the incompatibilities between Hypothes.is and the javascript in the interactive website, and they all felt that the digital annotations were burdensome in terms of time. Most of them were making annotations in their printed texts, and none of them spent much time looking at the annotations I or the other students had produced — so it’s natural that the digital version came to seem like busywork that reduplicated more productive personal annotation they’d already done. It is worth pointing out, however, that all three students saw the potential for the digital annotation to add to the text of Herodotus, especially through links to supplementary or complementary online material. One student also noted that the process of annotation made it easier to think about the text in terms of networks, which eased the transition to the network-analysis component of the course.
The network tools and approaches introduced in class inspired much more consensus among the students. All three judged themselves to be fairly proficient with network visualizations, at least at a basic level, by the end of the semester, and all three thought that network tools offered an interesting way to investigate ancient texts. Two of them agreed that they better understood the applicability of network analysis to ancient history, that the construction of their own network spreadsheets helped them to understand network approaches, and that they understood basic network statistics, specifically centrality (for each of these questions, a third student remained neutral).
Not surprisingly, the students’ preferred platforms were Gephi and Palladio. All three of them indicated that they felt comfortable with Gephi, and although only two indicated that they also felt comfortable with Palladio, those two chose Palladio as their preferred platform (the third chose Gephi). But more than one also noted that even at the end of the class, it was unclear how these network visualizations actually related to the formulation or investigation of research questions. Were they supposed to be exploratory, helping one to see where interesting questions might lie, or were they supposed to be research tools that could help demonstrate the validity of an argument? I think their confusion was directly related to my own uncertainty about this question at the beginning of the semester. Having now realized that we were working largely on the exploratory side, I think if I can lay this out at the beginning of the class next time, the students will be less unsure about the purpose of the visualizations.
This uncertainty was reflected in the role network visualization or analysis played in their final research papers. One student found network approaches largely irrelevant, even though the paper was on a topic related to genetics, a discipline that uses many of the same methods as network analysis. One was interested in using network approaches, but couldn’t find a way to relate them to the chosen paper topic (though after the class had ended, we discussed some possibilities for network analysis related to desert trade routes — I’d seen a paper on a similar topic at the Connected Past workshop in Paris in April). And the third was not at all interested in network approaches during the research process for a paper on the Delian League, and didn’t apply them to the paper — but began to see potential relevance after coming across the mapping component of the Phoros project, which seeks to produce a new multimedia edition of the Athenian tribute lists.
So on this last front — impact on student research — the course results were inconclusive. Judged by the extent to which the network tools and methods I introduced were used to generate or explore research questions in the students’ final papers, the course was a failure. But since all these students will be in our department for at least another year, I plan to follow up with them to see if the approaches we covered feed into their future research projects. It may be that it will take some time to work through the connections between these methods and the research areas that interest them. The students themselves were aware of the difficulties inherent in trying to master both new content and new tools in a single semester: one suggested that the course should have been divided into two sequential sections, with the first dealing with Herodotus and historiography and the second addressing network approaches. Another felt that a single semester wasn’t enough no matter how the course was divided, and proposed a two-semester sequence, again with content in the first course and networks in the second.
Conclusions
These comments lead me to a brief summary of the lessons I’ll take away from this course. I’ll provide them as numbered items for the benefit of those who are scrolling straight to the end of the post.
1. When you have a hammer, everything looks like a nail. It’s tempting to include a variety of digital tools because they seem like they’d be engaging. But it is preferable to integrate only digital tools that are very clearly suited to the course content, and have a very clear purpose within the framework of the stated course goals. This isn’t to say that one shouldn’t experiment, but one should avoid the inclusion of tools or platforms just because they seem interesting. Our successes all involved tools that were a good fit for the content and facilitated core course goals.
2. Less is more. Even if all of the tools you plan to include are suitable for the material and directly related to course goals, you should probably use fewer of them. This seminar would have been more focused and more successful if I hadn’t tried to do so many things at once. The students were game, but they only had so much time to commit to the class. The next time I teach a course like this, I’m going to start small — perhaps with only one digital tool — and build from there as the flow of the course permits.
3. Time and space are good to think with. One thing that came through quite clearly from both my own impressions and student comments is the usefulness of visualizations of space and time (or sequence) in the study of ancient history. The Landmark Herodotus, in fact, attempts to do this in print by including large numbers of maps and noting absolute dates in the margins of the text where they are available. We now have the capacity to represent both geography and the progression of events in richer, more interactive ways, and it’s worth bringing those into the classroom. The importance of these two axes was just as apparent to the students as they built their own network visualizations as it was to me when I agreed to integrate the Hestia interface with this class. Since the students quickly recognized the benefits of this sort of visualization, it seems like a good gateway for the introduction of digital resources. I’ve had good results with time/space visualization in the large lecture course I discussed in my first post, as well.
4. Know your audience. I wonder if the preference of the students in this course for printed materials represents a general phenomenon, or is specific to the sorts of people who choose to study the Classical world (or is a product of our training of Classics students). One of the three was a self-professed technophobe, which may also have had an impact on that student’s assessment of the class. I think it’s important to push students out of their comfort zone, but at the same time one has to be aware that they will struggle more, and have more negative reactions to the course, if they’re forced to do things in ways that are consistently uncomfortable. It’s not always just a matter of familiarity with new methods or media — some people will always prefer to read on paper, and those people shouldn’t be forced to read only on a screen. Part of the challenge of integrating digital tools and methods into our classes over the next few years will, I think, come from the need to balance new ways of looking and thinking with the preferences and experiences of our students.
And here we come back to the idea of the “digital native” that I criticized in my first post. I’m certainly not the first or only person to notice this, as the notes from a session on digital tools and grading from a recent THATCamp on digital pedagogy amply demonstrate. But it bears repeating that students can be avid users of Facebook and consumers of Youtube videos and still find it very difficult to learn to use new, often complex or non-intuitive digital tools in a classroom setting. I think that my Herodotus seminar demonstrated, through its successes, the value of introducing such tools and building a framework within which students can work with them; but its failures also showed that too much digital newness, especially without narrow, focused goals, offers rapidly diminishing returns.
Acknowledgements: I’d like to thank the Hestia2 team for the opportunity to participate in this project, which I found very valuable, and I’d especially like to thank Elton Barker, Leif Isaksen, Enrico Daga, and Eric Kansa for their collaboration on the design and finalization of the reading interface. I’d also like to thank Tom Brughmans for his input and suggestions for reading, and the Palladio design and development team — especially Nicole Coleman, Mark Braude, Giorgio Caviglia, and Ethan Jewett — for the invitation to participate in a Palladio workshop in May, and for the valuable conversations that happened during and after that event. Most importantly, I’d like to thank the three undergraduate students — Beth Rozacky, Alenis Leon, and Sterling Wright — who participated wholeheartedly in this somewhat experimental course, and to whose work and insights this final post is deeply indebted.