Reading Herodotus spatially in the undergraduate classroom, Part II
This is the second of three posts reporting on the deployment of the Hestia toolkit to teach Herodotus’ Histories in two college classrooms at The University of Texas at Austin. This post describes the integration of Hestia resources in the design of an upper-division research seminar intended for Ancient History, Classics, and Classical Archaeology majors. The seminar took the first four-and-a-half books of the Histories as a platform from which to explore historiography, ethnography, archaeology, and network analysis. The third and final post will discuss the successes and failures of this class from the perspectives of both students and instructor.
Adding the Hestia narrative timemap of Herodotus’ Histories to a large lecture course on Ancient Greece in the fall of 2013 was fairly straightforward. The interface itself was already in place, and had been finalized and stable for several years; it worked without any surprises. The course already covered Herodotus, and previous iterations already emphasized the work’s spatial aspect by requiring the Landmark edition and including map quizzes. Thus existing Hestia resources were layered onto an existing course, with minor adjustments to encourage the students to use them (see my previous post). I found this to be a useful experiment, but it fell far short of demonstrating the potential of the Hestia toolkit for student research and exploration. For students in the lecture course, the narrative timemap was still a platform for consumption, and I think that this explains their somewhat lukewarm response. As I argued in the previous post, real engagement with innovative digital resources is more likely to come when students are makers, not just users.
Happily, this wasn’t the end of the experiment. In Spring 2014, thanks to the support of the Department of Classics and the College of Liberal Arts at UT Austin, I was able to design and teach a small upper-division undergraduate research seminar on Herodotus. Seminars like this are a regular offering in our department; although they focus on historiography, they are open to majors in Classical Languages and Classical Archaeology as well as Ancient History. They serve to teach majors the tools of the trade and usually culminate in a research paper that can act as a dry run for a senior honors thesis. In short, both the goals of the course and the sorts of students who take it are ideally suited for an approach that focuses on students as producers of knowledge. Herodotus, of course, is a standard subject for courses on ancient historiography, so there was a natural connection here too to the work being done by the Hestia2 project team.
Over the fall and into the spring, this work included a complete overhaul of the interactive text of the Histories. One of the products of the Hestia2 project is the reconceptualization of the narrative timemap in the more streamlined GapVis platform, developed in conjunction with the Google Ancient Places initiative. GapVis provides an interface that again mashes up a text, a narrative timeline, and a map of the places mentioned in the text, but also adds other useful features, including a spatial overview of a given text, histograms or frequency measures for the appearance of individual places in that text, and place-detail pages that allow additional information about those places to be presented.
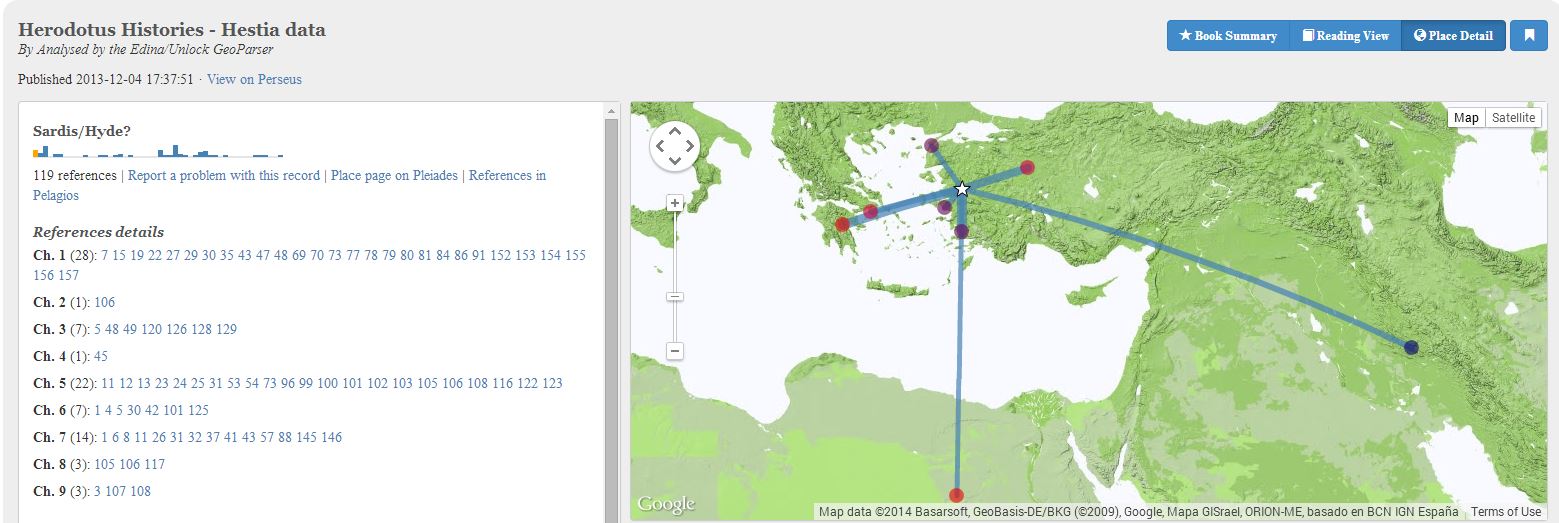
The migration of the Hestia Herodotus text to the new platform involved more than cosmetic changes. In the original narrative timemap, places mentioned in the text had been manually identified, geocoded, and classified. The text displayed in the GapVis platform, however, did not include these manual annotations. Instead, it was run through the Edinburgh Geoparser (currently publicly available through the Unlock API) to identify place names, and then reconcile these place names against the Pleiades database using the Pleiades+ script written by Leif Isaksen (now updated by Ryan Baumann). This meant that each place in the new interface is associated with a Pleiades URI, and is thus also connected to the Pelagios linked-data network. Furthermore, a co-occurrence network analysis based on proximity was conducted over the Histories, producing a graph of associations between sites that are frequently mentioned close together in the text. Place detail pages in the new interface thus contain not only information about where in the text a given place was mentioned, but also links to Pleiades and Pelagios, together with a list of the most frequently co-occurring places. The accompanying map visualizes the given place and its most frequent co-occurring sites as a simple egocentric graph (the image at the top of this post shows the detail page for Sardis).
This simple network visualization is only a minor part of a much larger body of work carried out by the Hestia2 PIs (Elton, Leif, and Stefan Bouzarovski), who have been exploring more comprehensive applications of both spatial and network analysis to the Histories. It therefore made sense to build network approaches into the seminar as well, to see how the new visualization platform could be used to introduce students to a mode of analysis that has replaced mapping as the new hot thing in literary studies, history, and archaeology alike.
So as I began to plan the course, I had to consider a new and improved interface and a new mode of inquiry beyond the spatial, as well as traditional scholarly training in historiography and in the relation between history and archaeology. The challenge was to come up with ways to do this that went beyond the standard discussion of readings and were informed by an interactive version of the Histories in addition to the usual printed material. At the second Hestia seminar hosted by the Center for Textual and Spatial Analysis at Stanford in the fall of 2013, I had a chance to brainstorm with other project participants about ways in which the platform could be used for more active learning. One of these, inspired by projects like Cyrus’ Paradise (a collaborative commentary on Xenophon’s Cyropaedia) and the community lyrics-annotation platform Rap Genius (now with ancient poetry and even ancient news too), involved giving students the ability to add their own annotations to the Hestia text.
Logging annotations while managing different levels of user authorizations and maintaining an editorial workflow turned out to be too complicated for the Hestia infrastructure. But Eric Kansa, a member of the web development team, pointed me to Hypothes.is, an Open Annotation platform that uses a plugin to layer user-generated annotations onto an existing website within a browser. Hypothes.is provided the final component in the toolkit I was envisioning for the class.
The resulting syllabus (available here) laid out four course goals: an introduction to ancient historiography, with Herodotus as the case study; a basic introduction to digital tools for the visualization and analysis of social networks, together with an exploration of their applicability to ancient history; an examination of the relationship between ancient history and archaeology; and the use of the new Hestia interface for the text of the Histories to inform or enhance student research. The first goal accounted for somewhat more than half of the assigned readings, and would be met with traditional in-class discussions. For the second goal, I set aside a number of class meetings for hands-on experimentation with different network visualization and analysis tools, and for workshopping the results of the work the students and I were producing outside of class. The last two goals would be facilitated through the Hypothes.is annotation platform: students would be asked to add annotations to follow individual actors through the text (as a foundation for network analysis) and to comment on the relation between Herodotus’ ethnographic descriptions and the archaeological record. I also created a group Zotero library containing the course bibliography, to which I planned to have the students add their own references, and which I hoped to connect to the Hestia interface through the annotation platform. At the same time, I reintroduced an analog resource that I had removed from the Introduction to Ancient Greece class: the Landmark Herodotus reappeared here as a required text.
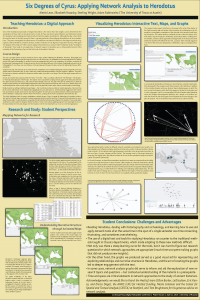
This choice proved to be significant. I will discuss its relevance, and the way the course worked in practice, in the next post, but I want to mention here a final element of the course design that emerged only after the semester had begun. In February, the Texas Digital Humanities Consortium announced its inaugural Annual Conference, to be held in Houston in April. The students and I, now wrestling with various digital network-visualization platforms, decided to submit an abstract for a paper describing our experiences. We proposed to discuss “the course design, the integration of the interactive interfaces produced by the Hestia project, and the digital tools and methods used for network analysis, spatial analysis, and annotation in the course”, and to address the success of these experiments (full text of the abstract is available here). When the abstract was accepted as a poster, we made a collective decision to add the conference to the curriculum. Three of the students and I worked on the content, design, and final layout of the poster together. Two of those students attended the conference with me and presented the poster during a “Minute Madness” presentation round. They were the only undergraduates at the conference, which was otherwise attended by graduate students and established scholars with digital expertise or projects.

Image of the poster presented by class participants at the inaugural Annual Conference of the Texas Digital Humanities Consortium at the University of Houston on April 11, 2014. Click on the image for a larger, legible PDF version.
In the spirit of the course, which was intended to help students learn how scholarly historical research is conducted, participation in this conference allowed the students to become part of a community of experts, and to produce work for the consumption of an academic audience. This was an unanticipated opportunity, but it was well aligned with a focus on students as makers of knowledge — and as makers who are responsible for the quality of the knowledge they make, in a way that goes beyond a research paper seen only by the student and the instructor.
I could end on a high note here — goals achieved! network diagrams created! students as knowledge makers! — but the full story of the course’s successes (and failures) is more complex. The TXDHC conference was held from April 10-12, so our poster was completed more than a month before the end of the semester, while students were still in the middle stages of their research projects. The next and final post in this series will provide an evaluation of the course after its conclusion, both from my perspective and from that of the three students who responded to a detailed qualitative survey.


You must be logged in to post a comment.