This week sees the third workshop taking place as part of Hestia 2. The event is being hosted by the University of Birmingham’s Digital Humanities Hub, which seems appropriate as it is a facility dedicated to bringing together scholars and practitioners from across disciplines interested in different ways of visualising the world.
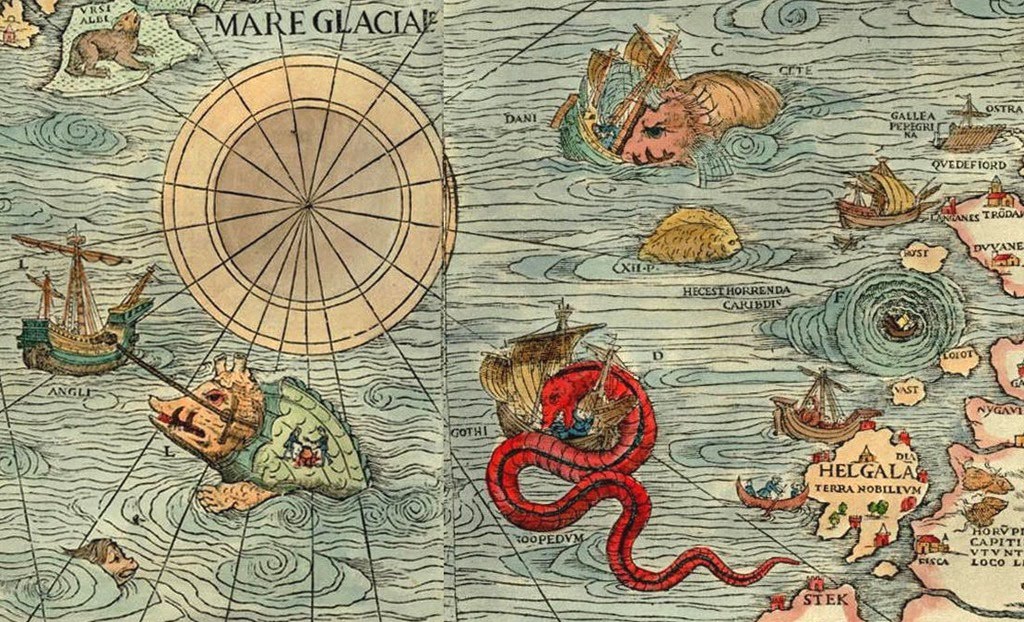
The theme of the workshop is qualitative GIS – techniques for exploring non-numerical data through mapping. This is a relatively new field, although not without important precedents. Historically, cartographers would add a range of images to their maps. These could range from drawings of mythical beasts animating far off lands to town plans complete with sketches of key buildings. These drawings went beyond cold, scientific representation to tell us something about the way places were imagined and lived. As Geographical Information Systems (GIS) were developed in the 1960s and 1970s they became a tool for representing numerical data, reflecting the fashion at the time for using computers to ask new, highly quantitative, research questions. In GIS, places are all-too-easily reduced to points, lines and polygons, all of which can have values attached to them. Conventionally these values were either numeric or comprised basic text strings, but as computers became more powerful in the 1980s, longer texts, photographs, audio and video could be added.
Read More»