Topotime: A data model and D3 layout for historical time
I was pleased to participate in the Hestia2@Stanford event held December 4-5, 2013 at Stanford’s Center for Spatial and Textual Studies (CESTA). The program, titled Visualizing Complex Networks, included several researchers from Stanford as well as a couple of digital humanities initiatives in nearby San Francisco. The plan was to share progress and prospects for some local projects that “explore network analysis and uncertainty in data from a number of different perspectives,” touching on topics and methodologies related to the Hestia project.

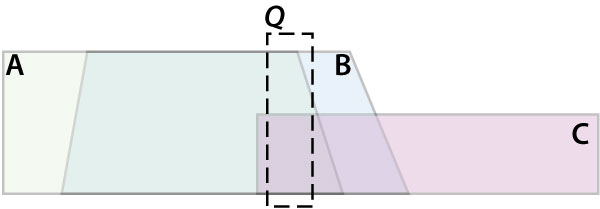
A few periods (A, B, C) and A query (Q).
My colleague Elijah Meeks and I had the opportunity to introduce publicly for the first time an experimental open software initiative we’d begun recently, called Topotime. Topotime is our pragmatic attempt to enable the encoding of complex and uncertain temporal expressions into a straightforward data model to support visual displays such as timelines, and for computing temporal and other relationships between events, historical periods, lifespans and such.
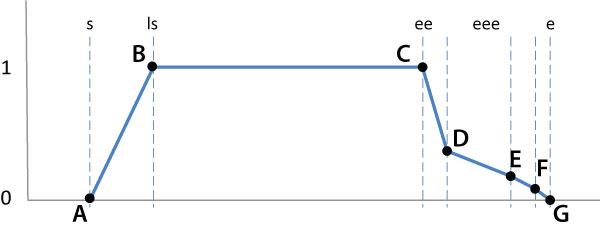
A “temporal geometry” generated for a period certain to be true between B and C, but with uncertain starting (A,B) and ending (C,D,E,F,G) spans.
So far we have developed a provisional data model (expressed in JSON, and soon JSON-LD), and two programs for parsing Topotime data files: one, written in JavaScript, generates timelines using the D3 graphical library. The second, written in Python in order to leverage the Shapely geometric library, generates “temporal geometries” with fuzzy (probabilistic) bounds, which can be queried for their intersection with each other and with any given timespan.
Topotime scaffolds earlier work by others and adds a few novel (we think) aspects. Topotime permits representing and computing over temporal expressions like, “about t,” “before (and after) t,” and “towards the end of t,” where t is either a year integer, some part of an ISO-8601 date expression, or importantly (and sometimes topologically), some part of another event or period. We enable encoding expressions of multi-part timespans, such as the “lifespan” of Poland, and including cyclical periods, like “the summers of her youth.” Topotime also models assertions of composite events and periods at any level of granularity, such as the lifespans of US states in the larger national lifespan visualized below.
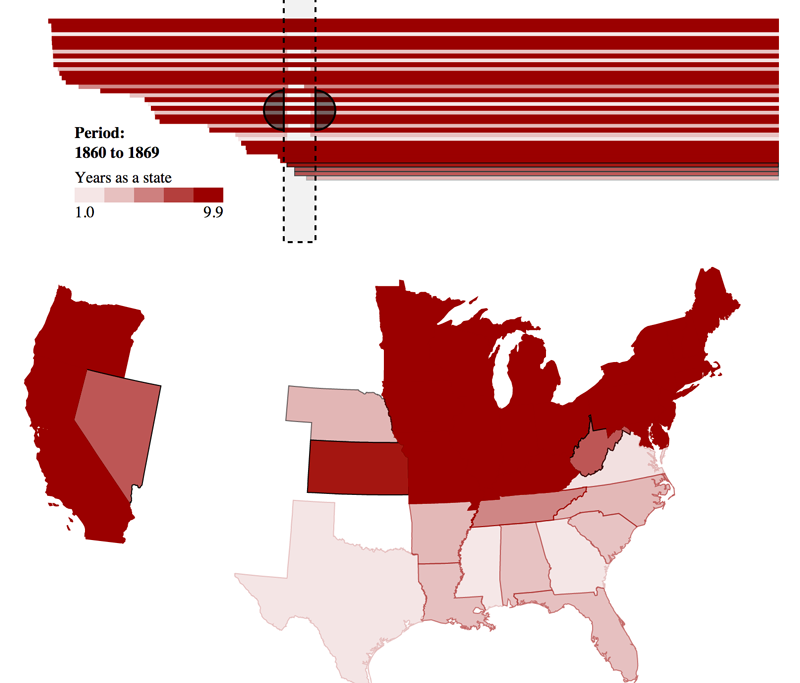
The “lifespans” of 50 US states, including the interrupted status of southern states during the US Civil War.
Since that presentation, we have posted the code on GitHub with a partial specification, created a web page “gallery and sandbox” for publishing a few early prototype applications of Topotime, and written something of these early efforts in a couple of places: a short piece on temporal geometry and a post on my Computing Place blog , titled Topotime and Place.
If this brief description and the figures above and below pique your interest, please do have a look at the above links to live examples. Elijah and I welcome (in no particular order) expressions of interest, critique, comments, suggestions, and collaboration, etc. (karlg [at] stanford [dot] edu). We are most grateful to the Hestia team for the opportunity to introduce this work, for their own inspirational work, and for their exceptional efforts at fostering global collaborative sensibilities amongst digital humanists and their fellow travelers.
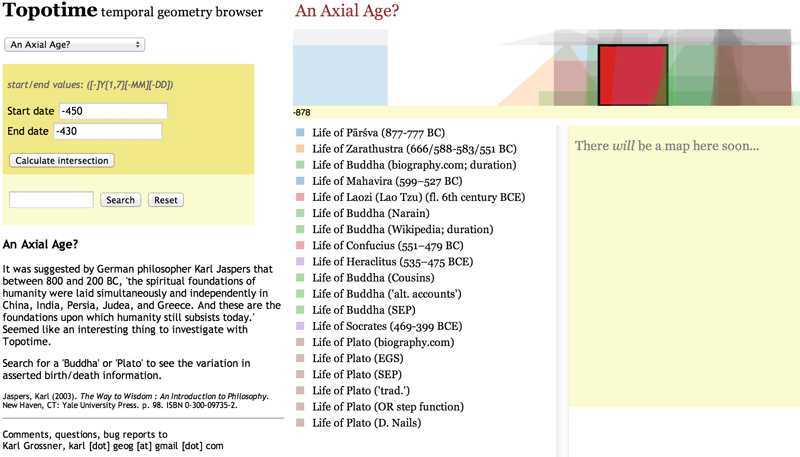
A “temporal geometry browser” for querying overlap and visualizing intersects in a Topotime “period collection” data set.